I have talked about how to simulate the Googlebot crawler to debug crawling and indexing issues.
In this guide, I will talk about how to use a very simple manual technique to efficiently diagnose rendering issues in Google's index.
Note: The technique of using rendered HTML from Google tools was dreamed up by Oliver Mason, SEO Consultant at ohgm. The original technical SEO, who writes edge case studies.
How to manually diagnose rendering issues
Right, onto debugging rendering issues in Google Search.
Step 1: Find the right page
Find the page you want to inspect and open it in 2 tabs in Google Chrome.
I usually try to focus on page templates on large websites. This helps to see issues which might scale across the website.
In this example, I wanted to test to see if Google was having any issues rendering the content of my newsletters over at The SEO Sprint (which uses the Substack platform).

Step 2: Grab the rendered HTML from the index
Once you've found the page and have it open in two tabs, all you need to do is head over to either the Google Search Console URL Inspection tool or the Mobile-friendly testing tool. The tool you use will depend on your level of access.
The URL Inspection tool uses the rendered HTML from the most recent crawl in Google's index.
This rendered HTML is the artifact that Google stores in its search index, which is used to assess the quality and relevance of your content.
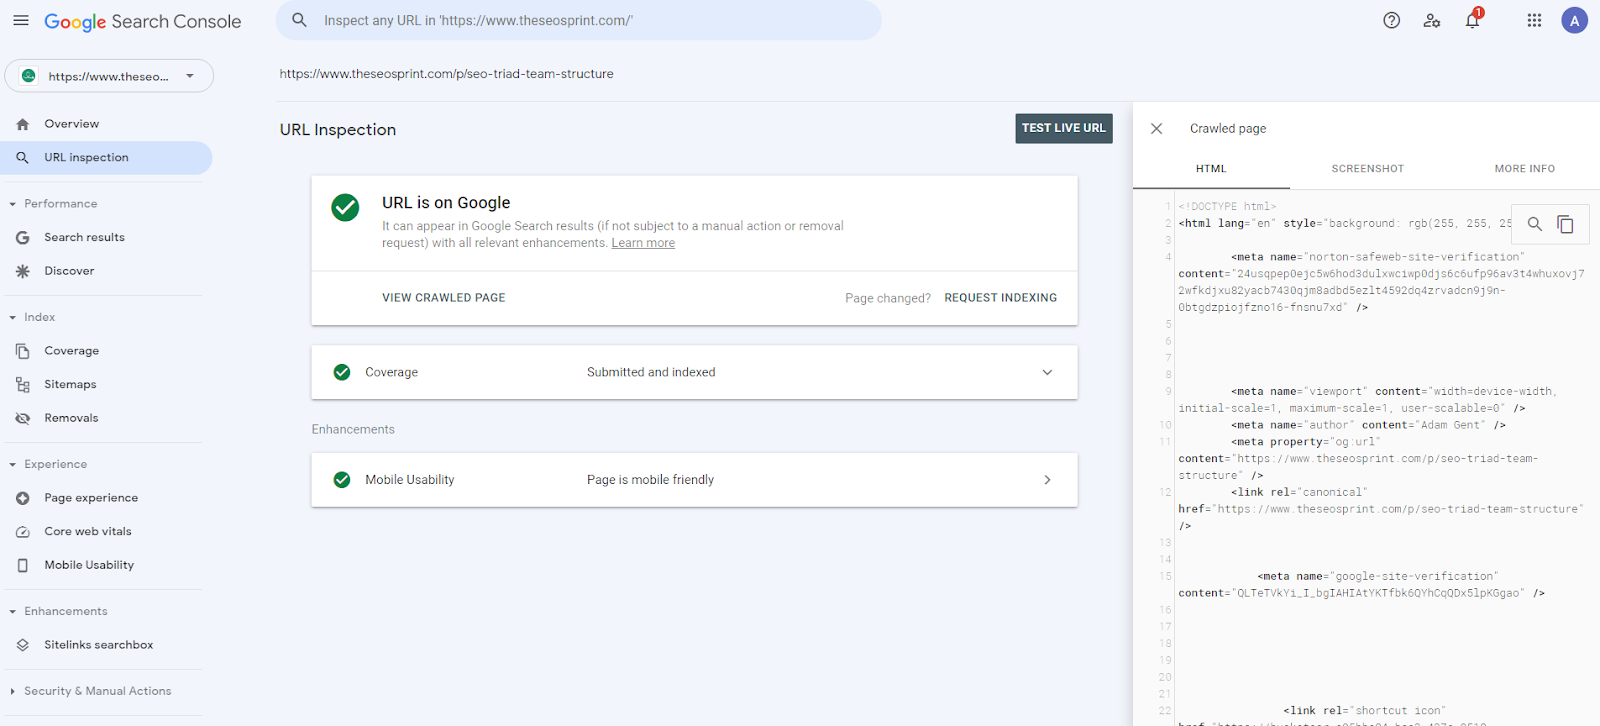
It is for this reason that gaining access to Google Search Console is critical to really understand how Google renders your pages.
This doesn't mean that the mobile-friendly tool is not useful in debugging rendering issues, but due to the different configuration settings between GSC testing tools and Googlebot's systems the results might be different.
For the best results always go with the Google URL Inspection tool > View Crawled Page (not the live test version).
If you don't have access to GSC then use the mobile-friendly test tool.
Capture rendered HTML from Google's index
Once you've picked the tool follow these steps:
- Submit the chosen URL into the URL Inspection tool.
- Navigate to the "View Crawled Page" button.
- This will open the Crawled page > HTML sidebar. All you need to do is click on the Copy icon.
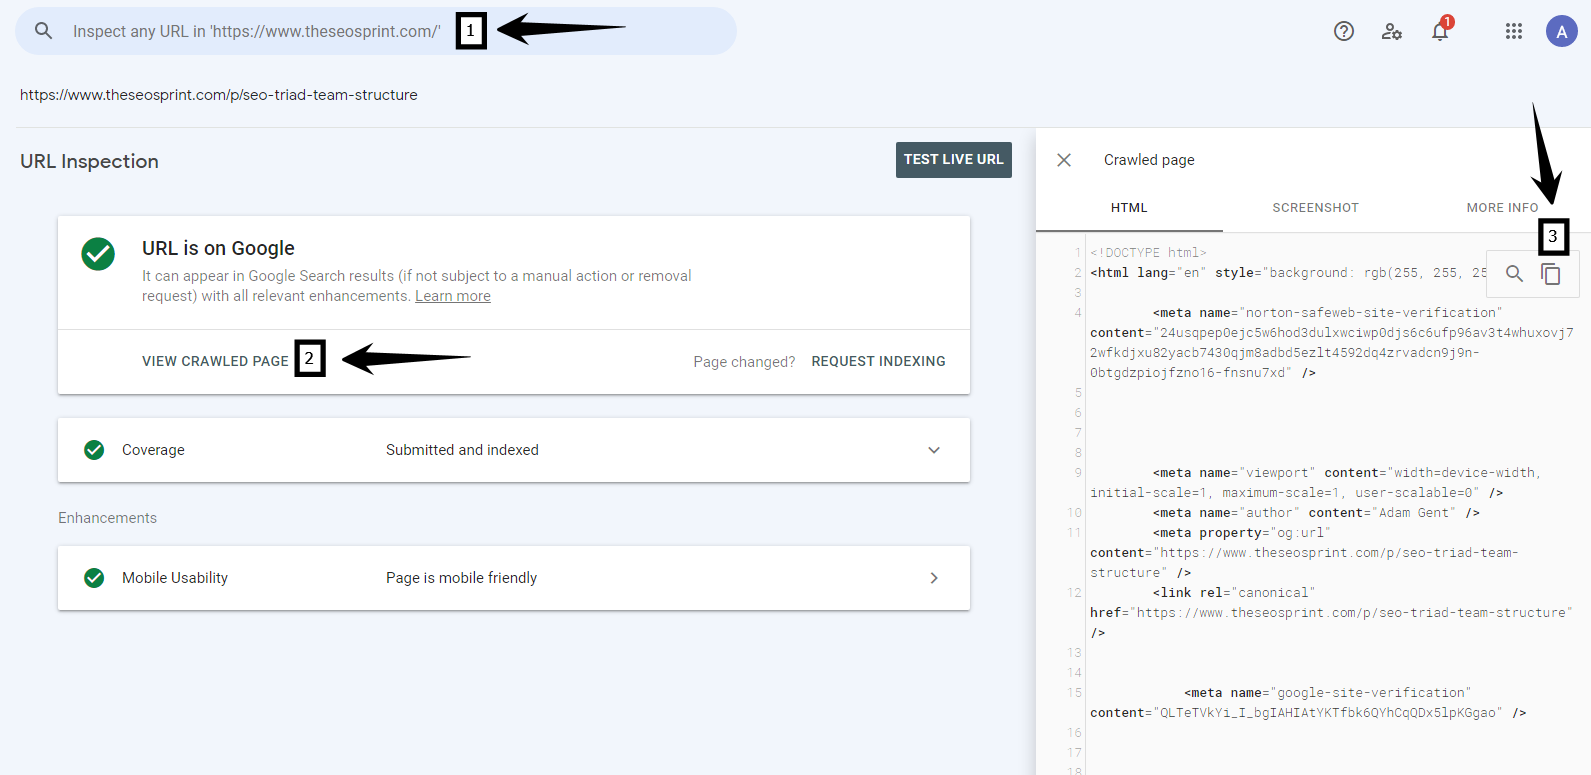
Step 3: Inspect the rendered HTML from Google
Now head back over to your two tabs.
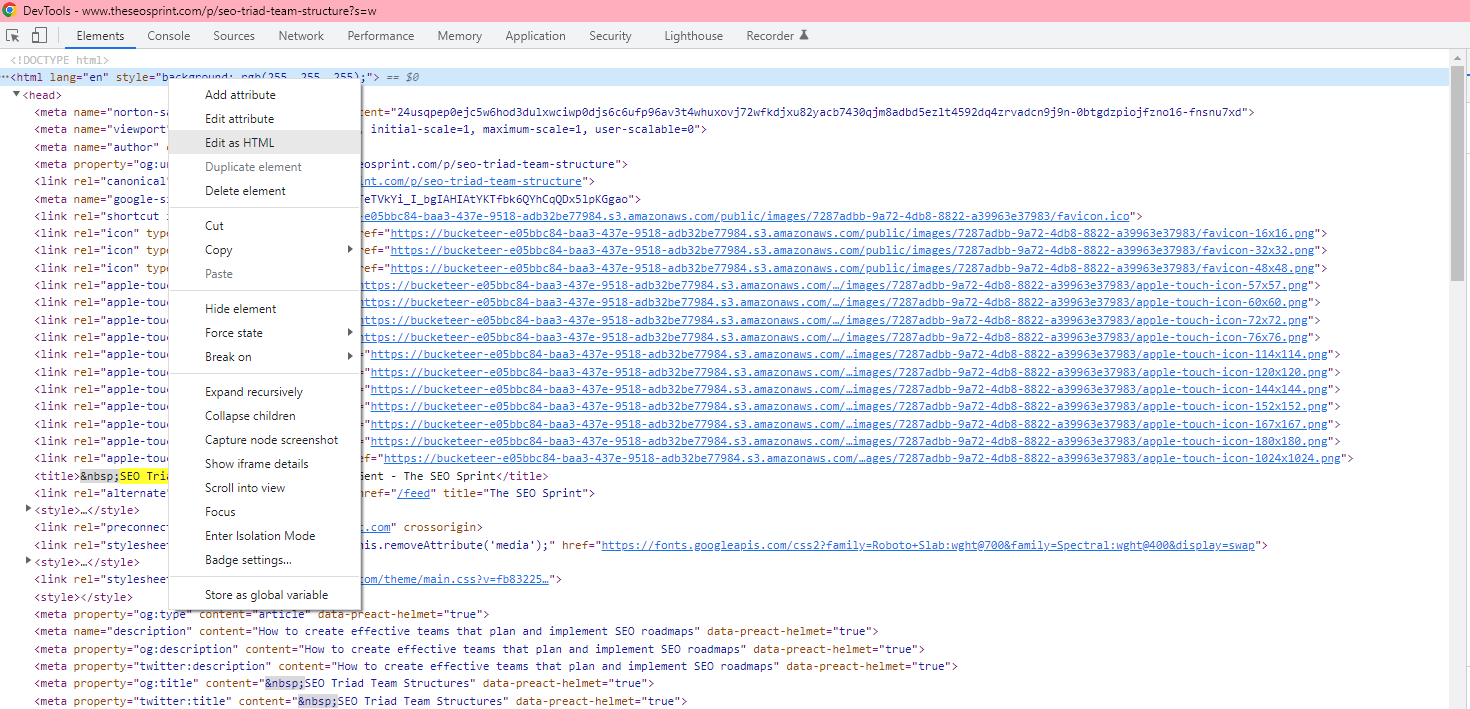
Right-click and inspect the element on one of the tabs. This will open Chrome DevTools and display the rendered HTML in your browser.
Right-click on the <html> element at the very top of the code and then choose Edit as HTML. Hit CTRL+A to highlight all the rendered HTML from the browser and hit delete.
Next, paste the copied rendered HTML from Google Search Console into the editable HTML of the page.
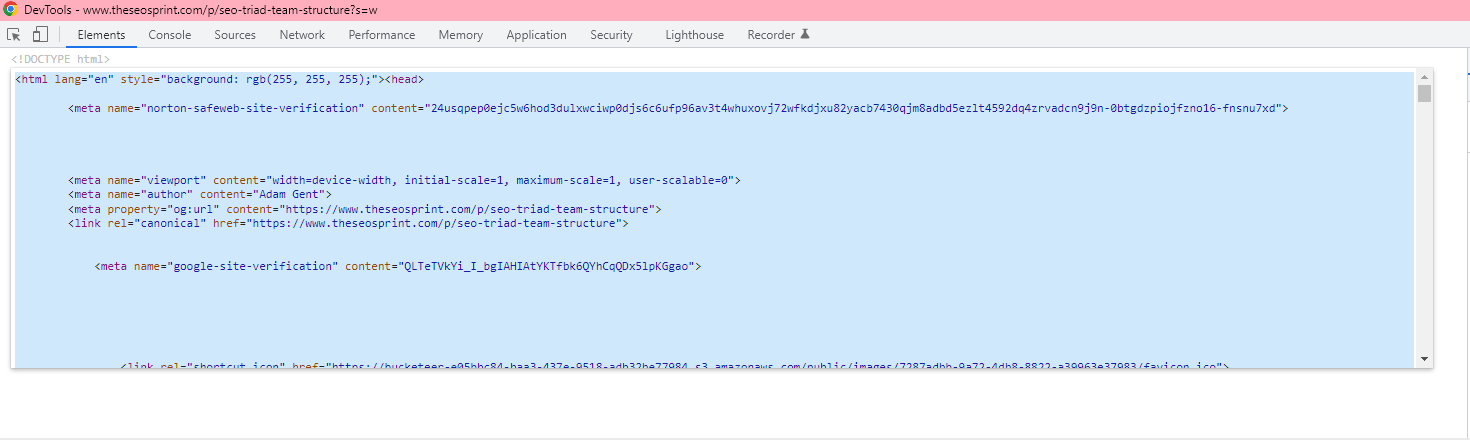
That is it.
Step 4: Compare Google rendered HTML vs current page
Return to your two tabs in Chrome and compare the two pages side by side.

Check to see if Google has missed or is not rendering any content on the page, quickly and easily.
Step 5: Inspect in Google Chrome DevTools
When you notice differences between the two pages, remember to check the Google Search index rendered code in the Elements tab of Chrome DevTools.
It is easy to get excited about differences, but always remember to check the code to make sure the content and links really are missing.
For example, the Substack personalised links that appear when you hover over my author profile picture are missing from the rendered HTML from Google's index, compared with the page loaded in incognito.

This makes sense if you read around how the Web Rendering Service works: it is stateless across page loads. It does not sign in or store any data from page to page (unlike your browser).
How can you use this technique to debug JavaScript SEO issues?
This technique can help you uncover a number of JavaScript SEO issues.
Content and links loaded by user events (scroll or click)
The UK ecommerce brand Fatface uses an infinite scroll to load more product listings on its category pages. If we use the mobile-friendly test tool (yes, I know, not as accurate) and copy-paste the rendered HTML into Chrome, we can instantly see a difference between the two pages.
If you keep scrolling on the rendered HTML from Google, you can see that not all the PLPs load on the page.

If we scroll down and check the code for the website, you can see that after a certain point the internal links to deeper level PLPs are missing in the rendered HTML.
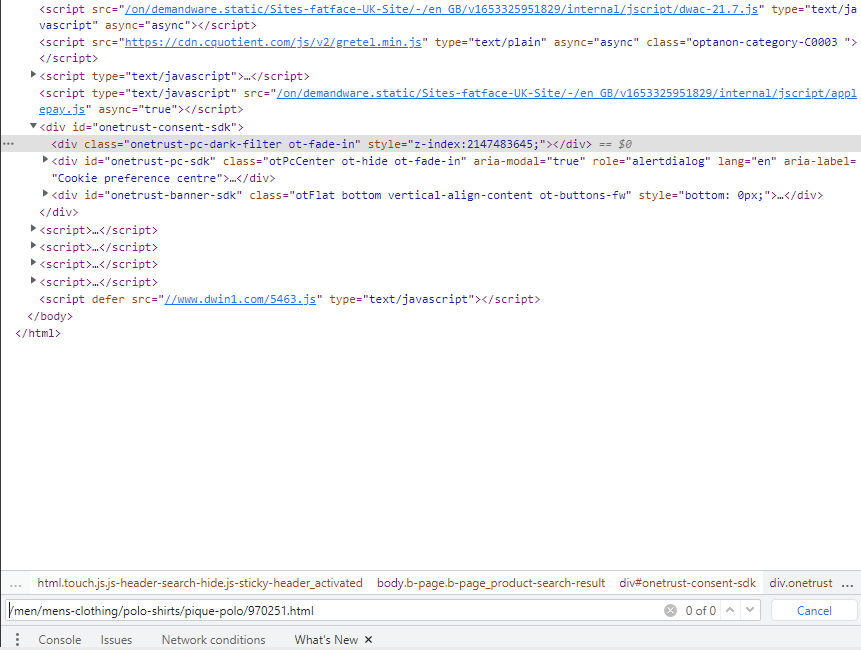
Missing navigation links
A few years ago I noticed ASOS was not rendering the main navigation in the mobile-friendly testing tool. It turns out that a lot of other SEO issues also contributed to ASOS's SEO traffic dropping.
Lazy loading images not rendering properly
Developers can rely on JavaScript to lazy load images from third-party CDNs, and sometimes it can be a problem for Googlebot to access these resources.
Other JavaScript SEO issues
There are a number of other issues which you can also detect:
- Critical content not rendered by Googlebot
- Critical resources (CSS and JS) not accessed by Googlebot
- Strange client-side redirects stopping Googlebot from accessing the website
- Etc.
Summary: I, Web Rendering Service
There we go, a simple and efficient way to diagnose JavaScript SEO issues using Google Chrome.
Frequently asked questions
Why is the layout different to my page?
The rendering of the page might look a bit off compared to your current page. This isn't always an issue if the rendering snapshots in the mobile-friendly test, URL Inspection tool and Rich Results desktop test show it renders fine.
Do I trust what I see in the browser?
I always check the rendered HTML in the code in both Chrome and in the URL Inspection or mobile-friendly testing tool to make sure the links and content are there.
What if I can't use the URL Inspection tool?
I'd recommend using the mobile-friendly testing tool or the Rich Results test. Both tools use the Web Rendering Service. The one issue is that these tools don't wait around if the website is slow, unlike the real WRS. Although this does highlight bigger web performance issues.
